Every machine on your floor. Every state. The moment it happens.
MACH Monitor connects directly to your assets and reports live machine state for every machine on the floor: running, idle, faulted, in changeover, in maintenance. Operators classify downtime in two taps. OEE and the KPIs you define compute in real time. No MES required.
Our team on OEE in The Fabricator: How to Make OEE Work in a Job Shop →
Last updated: July 6, 2026
Every machine. Every state. Right now.
Stop walking the floor to check a machine. Real-time machine monitoring connects to your machines and equipment and reports live state for every machine the instant it changes: running, idle, faulted, in changeover, in maintenance.
Here's what you're seeing. Every asset on your floor, on one screen. For each one you're seeing its live state right now (running, idle, or down), its performance KPIs, whether it's keeping pace with the schedule, and how far its current order has progressed. Every tile is one machine, and the color comes straight from the machine itself, no manual entry. Watch one flip from running to idle: that lands the instant it happens, not in a shift report three hours later.
- You see the real-time status of every machine on your floor (running, idle, faulted, on break, in changeover, or in maintenance), updated the instant conditions change.
- Real-time state is derived directly from each machine's datapoints. You set the logic in the app, with no code to write. Every machine can have its own rules and configuration, down to on/off delays that filter out noisy signals before a state change registers.
- Connect to your machines in minutes. MACH works with the equipment you already have: PLCs, HMIs, sensors, or IoT gateways. If you need hardware, we can provide plug-and-play sensors or PLC-to-cloud gateways that get your machines talking to MACH. Once connected, MACH automatically discovers every data point your equipment is sending, so you just pick the ones you want to track.
- You access historical dashboards going back to day one. Every shift, every machine, every metric, stored and queryable from the moment data collection begins.
Context captured at the source. By the person standing next to the machine.
The context you would otherwise reconstruct from memory is captured at the source. The operator kiosk is a shop-floor touch device at every work center, where operators log shift data, downtime reasons, order changes, and breaks as they happen.
Here's what you're seeing: This is the screen at the work center, sized for gloved hands and readable across the cell. The operator runs the shift from here: start and end shifts, pause and resume orders, log a break, classify a stop, record a reject, all in a tap or two. Nothing gets reconstructed from memory at the end of the day, because it was captured the moment it happened.
- The full-screen background glows the current machine state (green running, yellow idle, red faulted), so anyone can read the cell at a glance from across the floor. A horizontal shift timeline shows the last 8 hours of state history as color-coded blocks. Tap any segment to see the state and exactly how long it lasted.
- The order progress card shows current job number, progress bar, elapsed time, estimated remaining time, remaining units, and cycle average. Green, yellow, or red schedule-delta badges show whether the machine is ahead, on time, or behind for the current order and the day overall.
- Operators run the whole shift from the kiosk: browse a multi-day schedule with search and priority badges, start and end shifts, pause and resume orders, and classify downtime. Declaring a break is one tap, and a live timer in the overlay shows how long it has run.
- Reject recording is built in with guided workflows. Every reject logs against the active order and feeds quality analytics.
- When a machine has been idle past a threshold you set, the kiosk prompts the operator to classify the stop: category, then reason, two taps. If stoppages stack up while the operator is busy, they queue and get cleared in order. No stoppage goes unrecorded.
- Maintenance runs as Preventative or Breakdown, with full integration into MACH Maintain coming later this year.
- Changeover starts and ends automatically from order transitions and machine activity, or auto-ends if the machine runs past a threshold you set, so it never over-accumulates. A live timer turns red past the goal, and if a break interrupts a changeover it suspends and resumes on its own.
- Operators can enter operational data directly from the kiosk, like pieces per cut if bundle cutting on a saw. These inputs flow into KPI calculations and production tracking in real time.
Production counting that adapts to the machine. Not the other way around.
However your machines report output, the count is accurate and automatic. Production counting supports four detection modes, so cumulative counters, rate-derived flow, scan-based change detection, and manual kiosk entry all feed one production record.
Here's what you're seeing. However a machine reports output, MACH counts it. A cumulative counter gets read by difference, with a configurable limit that filters out impossible spikes from resets or bad data. A rate gets turned into quantity over elapsed time. A barcode scan or signal change fires a count, with a debounce window that prevents double-counts from duplicate reads. Anything manual is entered right at the kiosk. And one machine can track more than one unit at once, like cuts and linear feet, or sheets and weight, each counted its own way.
- MACH reads the running total and takes the difference between readings, handling counter rollover automatically. A configurable max-delta filters out impossible spikes from counter resets or bad data.
- MACH derives quantity from rate times elapsed time, with no discrete counter needed. The rate unit is configurable to match however the machine reports.
- When output shows up as a changing value (a barcode scan, a part ID, a signal transition), MACH fires a count on each change. A configurable debounce window prevents double-counts from duplicate or noisy reads.
- For manual processes like hand-fed presses or visual inspections, fixed counting lets the operator enter output by hand from the kiosk.
- A single machine type can track several production units at once: cuts and linear feet, sheets and weight, pieces and rejects. Each gets its own counter mode, formula, precision, and reject flag. Formulas can transform raw counts into meaningful quantities, like multiplying cuts by cut length to get linear feet.
- Beyond counts, MACH captures raw and derived telemetry (pressure, temperature, vibration, speed), stored with timestamps per machine for history and export. Each has its own capture interval and can be limited to active shifts or running time only.
The floor TV that actually tells you something.
The floor display puts live machine state, OEE, KPIs, and order progress on a wall-mounted screen, readable from across the bay and auto-cycling when there are more machines than fit.
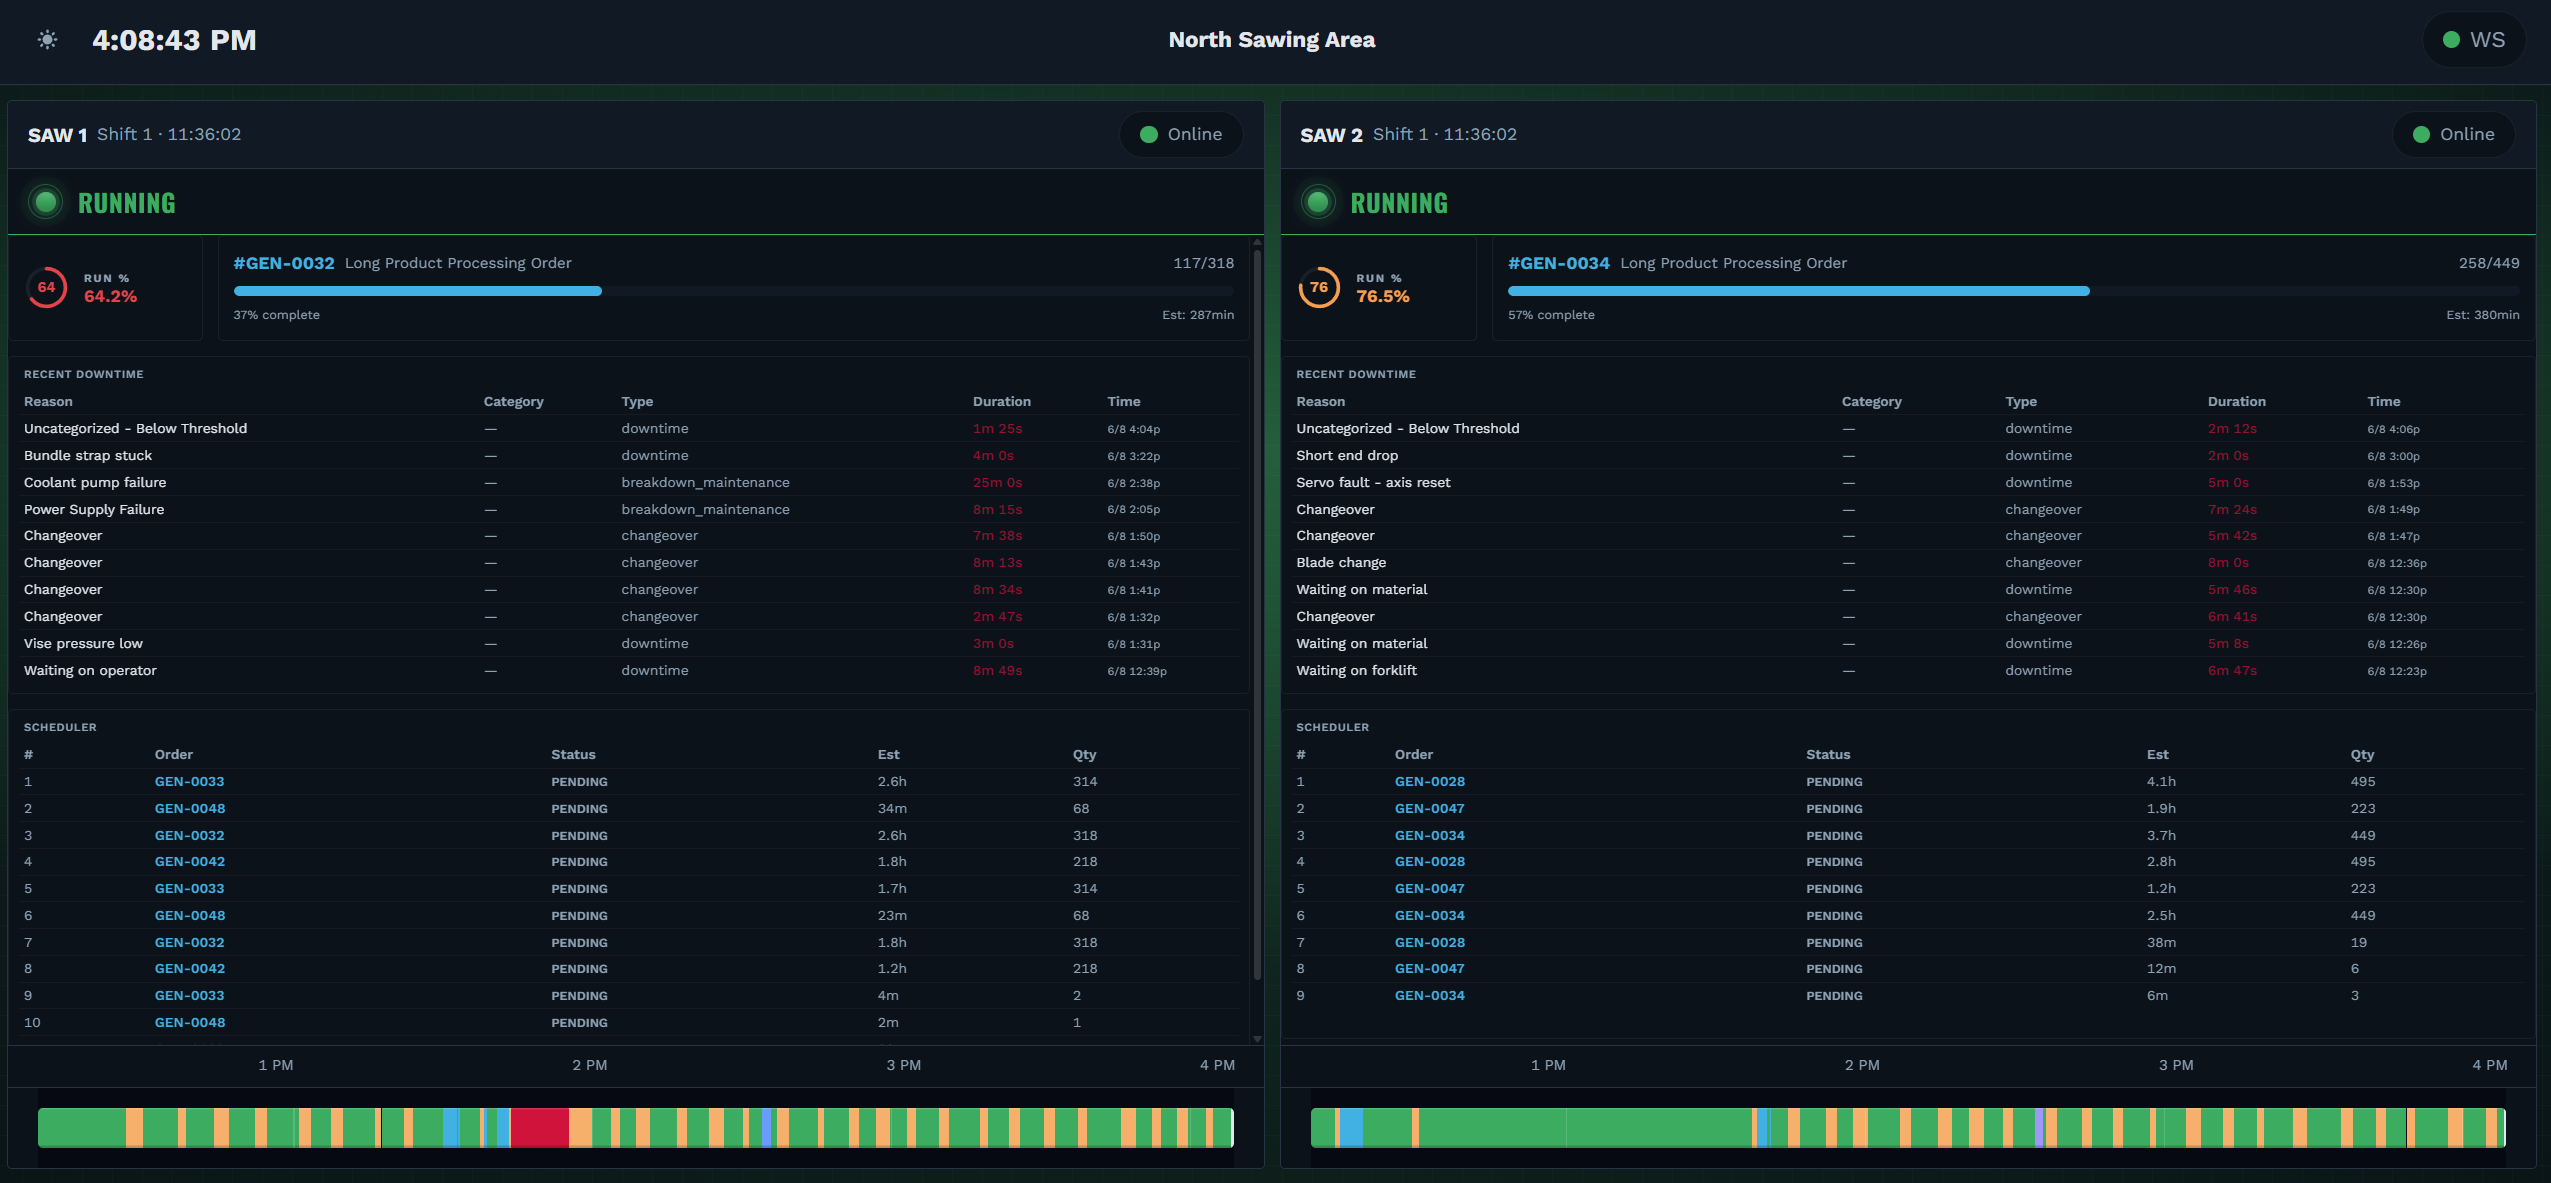
Here's what you're seeing. This is the same data on the wall, sized to read from across the bay. Up to four machines a page, cycling on their own when there are more than fit, each showing the KPIs and widgets configured for its type and a state banner with a colored indicator you can read at a glance. Everyone, operators and supervisors and maintenance, sees the same picture at the same time.
- Live data pushed to the screen in real time: machine state, production metrics, order progress, downtime events, and estimated completion times. Up to four machines per page, and when more are connected than fit, the display auto-cycles on an interval you set.
- Each machine shows its own KPIs, so a bandsaw and a CNC side by side display what matters for each. Build and rearrange each layout with a drag-and-drop editor you can manage remotely.
- Operators, supervisors, and maintenance all see the same picture at once. No waiting for a report, no walking to the office to find a screen.
- A schedule view shows upcoming orders with order numbers, planned quantities, and time blocks, so the floor can see what's next at a glance.
Questions about MACH Monitor.
What monitoring features does MACH include?
MACH Monitor includes real-time machine state tracking (running, idle, faulted, in changeover, in maintenance), two-tap downtime classification from the operator kiosk, automated production counting across four counter modes, floor display dashboards, role-based access control, and multi-plant access with SSO. All data is visible in MACH Hub's reporting and analytics module.
Does MACH do real-time machine tracking?
Yes. Machine tracking in MACH Monitor is real-time — it connects directly to your equipment and reports live machine state (running, idle, faulted, in changeover, in maintenance) for every machine on the floor. Tracking is automatic once a machine is connected, with each machine's own state rules, so you see what's happening the moment it happens.
Does MACH Monitor require a MES?
No. MACH Monitor works independently of a MES. It connects directly to your machines and equipment for machine data and uses an operator kiosk for context capture.
What is the pricing for MACH?
MACH is priced per work center per month on annual billing, with volume tiers that lower your rate as you scale. Every product includes unlimited users, unlimited orders, and all features. No locked features. See the pricing page for full tier pricing.
How does MACH connect to my machines?
MACH works with the equipment you already have: PLCs, HMIs, sensors, or IoT gateways. If you need hardware, we can provide plug-and-play sensors or PLC-to-cloud gateways that get your machines talking to MACH. Once connected, MACH automatically discovers every data point your equipment is sending, so you just pick the ones you want to track. You set the state logic in the app with no code to write, and every machine can have its own rules and configuration, down to on/off delays that filter out noisy signals.
How far back does MACH store data?
There is no retention limit. Every state, count, and event is stored and queryable back to day one, so your dashboards and trends reach back to the moment data collection began.
Can MACH handle multiple facilities and different types of equipment?
Yes. MACH is built for large, multi-plant enterprises. It unifies metrics across sites and equipment types, so a bandsaw in one plant and a CNC in another roll up into the same dashboards and KPIs, with role-based access and SSO.
Can operators log rejected parts from the kiosk?
Yes. The reject recording flow on the kiosk walks operators through quantity (+1, +5, or +10 buttons with a reset), category, and specific reason. Every reject is logged against the active order and flows into quality analytics. Reject tracking is configured per production unit, so a machine that counts both pieces and weight can track rejects independently for each.
All of this. $214 per work center per month.
Unlimited users. Unlimited orders. You pay per work center, and the rate drops as you scale.