Your KPIs. Your formulas. Not someone else's idea of what matters.
MACH Reporting & Analytics is the factory's single source of truth. Define the metrics that matter to your operation, see them on dashboards you build, and trust the numbers because the data flows straight from the floor and the schedule. MACH suggests a starting point. What you measure is up to you.
Last updated: June 16, 2026
Build the view you want to look at. Drag, drop, done.
The dashboard builder turns your KPIs and queries into custom dashboards: charts, gauges, KPI cards, and tables on a grid you arrange, organized in folders and reusable as templates. Filter by plant, machine type, shift, and date with flexible groupings for monthly, quarterly, or annual reporting.
Here's what you're seeing: drop widgets onto a grid and point each one at a KPI or a data query. Scope a dashboard to the plant level to view KPIs common to all equipment and schedule attainment, or scope to a machine or station type to drill into the details of that asset type. Build a dashboard and clone it, or copy individual widgets to another.
- Add charts, gauges, KPI cards, and data tables, each linked to a KPI definition or a data query.
- Organize dashboards in folders by role, machine type, facility, or function, with a navigation tree for the sidebar.
- Dashboards scope to a plant or machine type, so one layout serves many contexts. You control which filter dimensions are available to users.
- Data tables are sortable, filterable, and export to CSV in a click. The data underlying any chart can be exported the same way.
Measure what matters to you. We suggest. You decide.
The custom KPI builder lets you define any metric with a flexible formula language, set targets and thresholds, and feed it to every report and dashboard. Once defined, a KPI is reusable across the reporting app and the shopfloor, so the same formula shows up on a wall display, a kiosk, and a monthly review. MACH ships sensible defaults, but you are never locked into them.
Here's what you're seeing: a KPI built and charted in under a minute. Pick your inputs, write a formula, set a target and color thresholds, and drop it onto a dashboard. OEE, scrap rate, throughput per hour, yield by material grade, whatever your operation tracks. Change the formula once and it updates everywhere it appears.
- Write KPI formulas in a safe, simple expression language with access to time buckets (run, idle, downtime, changeover seconds), production counters, and step and order context. No code changes.
- Built-in functions handle the math, so you don't have to.
- Set a target and a direction (higher is better for OEE, lower is better for scrap), then define color thresholds so dashboards show green, yellow, or red at a glance.
- Choose the context of the KPI, whether it is grounded in shift or order information, and override the target per machine while keeping one formula.
One view across Monitor and Schedule. Merged in real time.
MACH Monitor, Schedule, and Reporting are one system. Execution data from the floor and the schedule is merged in real time into a single, current history, so every user sees one complete view with nothing to pull or reconcile by hand.
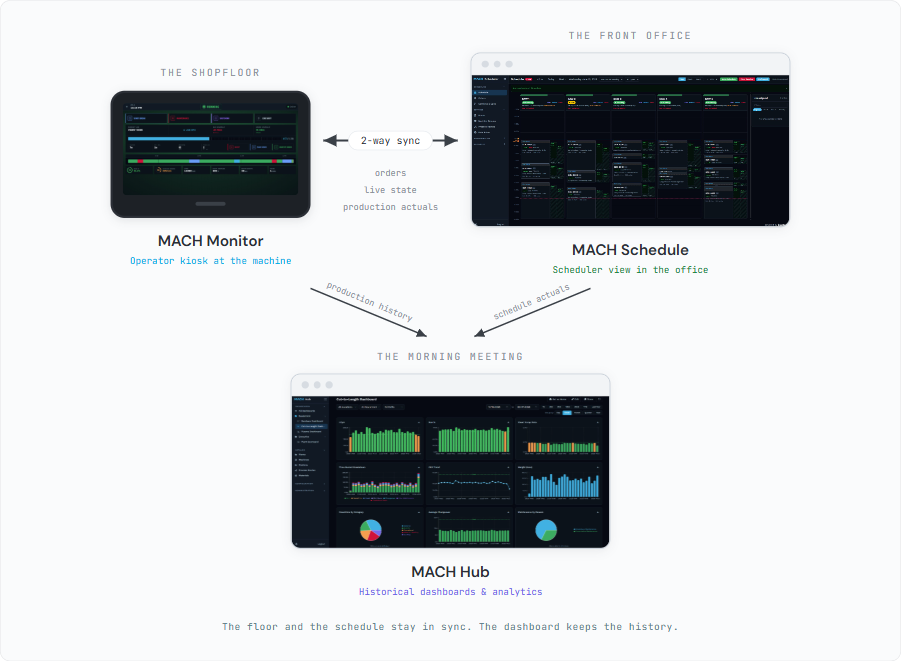
Here's what you're seeing. Every completed order step, every shift, every machine day, every downtime event, and every planned-versus-actual schedule record lands in one place as it happens. No pulling from separate systems, no reconciling spreadsheets. That history is what your KPIs compute against and your dashboards draw from, and it goes back to the day collection started.
- Query by order step to see run time, downtime, production counts, rejects, and the full order context for every job that ran on every machine.
- Query by shift or by day to see time breakdowns, production totals, and operator detail rolled up to the level you need.
- Every classified downtime event is stored with its category, reason, and duration, and every scheduled order carries its planned-versus-actual performance.
- History goes back to day one with no retention limit. Filter by plant, machine, shift, operator, or date range.
One place defines the whole factory. Everything else follows.
The factory catalog is the definitive source for your plants, machines, order schemas and material types, machine types, and processing routes. Configure it once here and changes replicate to Monitor and Scheduler automatically.
Here's what you're seeing: how the catalog feeds the rest of the system. Order schemas, process routes, and machine capabilities replicate to Schedule. Data models, sensors, and KPI definitions replicate to Monitor. Plants, machines, and machine types replicate to both. Define anything once in Hub and every app that needs it picks it up automatically. No re-entry, no sync to manage.
- Define plants, work centers, machine types, machines, and manual stations in one catalog.
- Machine-type profiles standardize a class of equipment: production units, data points, KPI definitions and performance goals, downtime and reject reason codes, step parameters, and capability specs.
- Capability specs (max width, max thickness, supported materials) flow to Scheduler and drive capability-based machine assignment. Browse specs across your machines to see what your equipment can handle. Coming soon: a capability search that matches an RFQ to the machines that can run it.
- Order schemas define the custom fields that travel with an order. A CNC job may carry a CAD file and QC instructions, while a sawing order carries cut length and bundle size. Fields auto-populate from the selected material, and formula-derived fields compute from each other, so order entry is fast and consistent. Orders can also be imported directly from your ERP.
- Process routes define the sequence of operations to produce a product. Each route links machine types into multi-step recipes with step parameters, dependencies, and workcenter assignments.
- Material types and specific materials define what you run. Properties like grade, gauge, and density carry through to order fields and KPI calculations. A shared units-of-measure registry with conversions keeps everything consistent across the catalog.
One bad shift doesn't ruin the month. Fix it, flag it, and move on.
Corrections, data invalidation, and period tagging keep your analytical record accurate and in context. Every change is logged with who, what, when, and why.
- Correct production records after the fact. An operator forgot to log off and downtime accumulated overnight? Fix it with a mandatory reason, and the original values are preserved alongside the correction.
- Every edit is logged with who changed what, when, the old and new values, and the reason, in a tamper-evident, queryable audit trail.
- Soft-exclude bad records from calculations without deleting them. Invalidation is reversible, so nothing is lost permanently.
- Mark date ranges with context like trial runs, bad material, or equipment testing, so reports reflect what was normal and what wasn't.
- Global downtime and reject reason libraries keep classification consistent, with per-machine-type additions and overrides.
Structured endpoints for retrieving analytical data.
A read-only API exposes the same analytical data your dashboards show. Connect it to your favorite BI tool, data warehouse, or data lake, so MACH data lives alongside the rest of your business.
Here's what you're seeing. The same facts that power your dashboards are available through structured, read-only endpoints. Pull machine-day metrics, shift performance, order step detail, classified downtime, or planned-versus-actual schedule data into a spreadsheet, a BI tool, or another system, filtered by machine and date range.
- Machine-day metrics: daily time buckets and production by machine and date range.
- Shift data: shift-level performance with operator and time detail.
- Downtime events: classified downtime with duration and reason, filterable by machine and date range.
- Schedule performance: planned versus actual steps and duration.
True cost-to-serve. The number that changes every decision.
Your quoting model uses standard costs. Standard costs don't see the actual changeover time between jobs, the scheduling disruption from a late material delivery, or the overtime your floor absorbed when a run took twice as long as the estimate. MACH captures all of it. When cost-to-serve analytics ship, every product, every customer, and every order will have a real production cost attached to it. Some manufacturers who run this analysis find their fastest-growing product is their least profitable. That changes the conversation.
Product-level cost-to-serve
Actual production cost per unit, per product, per customer.
Customer profitability
Which accounts generate margin and which erode it.
Quoting accuracy
Quotes built from real production data, not standard cost assumptions.
The production data captured by Monitoring and Scheduling today is the foundation for cost-to-serve. When this capability ships, the data is already there.
We wrote about what this looks like on a real floor: What the job actually cost.
Continuous improvement that proves itself. With the data you already have.
Most CI projects start with a spreadsheet and end with a debate about whether the numbers are real. MACH connects improvement projects directly to production data. Define a baseline period, set KPI goals, and let MACH compare before and after using the same data that drives your dashboards. The numbers are consistent, auditable, and nobody has to argue about the methodology.
Before/after scorecards
Actual KPI values, deltas, and pass/fail indicators for every goal. Statistical confidence tells you whether the improvement is real or within normal variation.
Multi-period tracking
See if improvements hold over time or regress after the initial push. Break results down by shift and crew to see where gains are concentrated.
ROI calculator
Map KPI improvements to estimated dollar savings using your cost assumptions. Downtime cost per hour, scrap cost per unit, whatever your operation uses.
CI projects reuse your existing KPI definitions and catalog. If your dashboards already track OEE, changeover time, and scrap rate, your CI projects target those same KPIs out of the box.
Questions about MACH Reporting & Analytics.
Can we define our own KPIs?
Yes, and that is the point. You define any KPI with a flexible formula language using time buckets, production counts, and order context, set targets and color thresholds, and use it across dashboards and reports. MACH provides suggested KPIs as a starting point, but you can change them or build your own from scratch.
What is MACH Reporting & Analytics?
MACH Reporting & Analytics (MACH BI) is the factory's single source of truth for configuration and production analytics. It masters your plants, machines, materials, and processes, and merges execution data from MACH Monitor and Scheduler in real time into a single, integrated history you report on with custom KPIs and dashboards.
Can we use our own BI tools and data warehouse?
Yes. A read-only API exposes the same analytical data your dashboards use, so you can pull machine-day metrics, shift data, downtime, and schedule performance into your favorite BI tool, data warehouse, or data lake. And because production data flows into MACH automatically from Monitor and Scheduler, there is nothing to pipeline first.
Does changing a KPI require coding?
No. KPIs are defined in a visual editor with a formula language, not application code. You write or edit a formula, set its targets and color thresholds, and it takes effect everywhere it is used, across dashboards, reports, and the floor and schedule displays. No developer, no release, no waiting on IT.
Can MACH extend its APIs beyond the standard endpoints?
Yes. The standard read-only endpoints cover most needs, but the MACH team can extend the APIs to fit your use case. Reach out and we'll scope what you need.
All of this. Included with MACH Complete.
Reporting and analytics comes with MACH Complete, built on the data MACH Monitor and Schedule already capture. It is not priced separately. See the pricing page for Complete tier pricing.